Jake Smith's Portfolio

Over 15 Years of Experience Building Digital Products

  • Projects
  • Résumé
  • UX Process
  • Insights
  • Hobbies & Art
  • Contact Me

Delphix - Data Control Tower

February 04, 2025 by Jake Smith
View fullsize Storage Workflow.png
View fullsize Bulk Add _ Remove Tag Flow.png
View fullsize Insights - Data Governance Coverage.png
View fullsize Operations.png
View fullsize Data Engnies - Storage.png
View fullsize Data Engnies - Performance.png
View fullsize Data - VDB - Timeline History.png

Product Background

Delphix provides enterprise data management solutions through two core products: Virtual Databases (VDBs) and Data Masking. VDBs enable companies to create space-efficient database environments for development and testing, while Data Masking allows organizations to protect sensitive information by replacing production data with realistic but anonymized data in non-production environments.

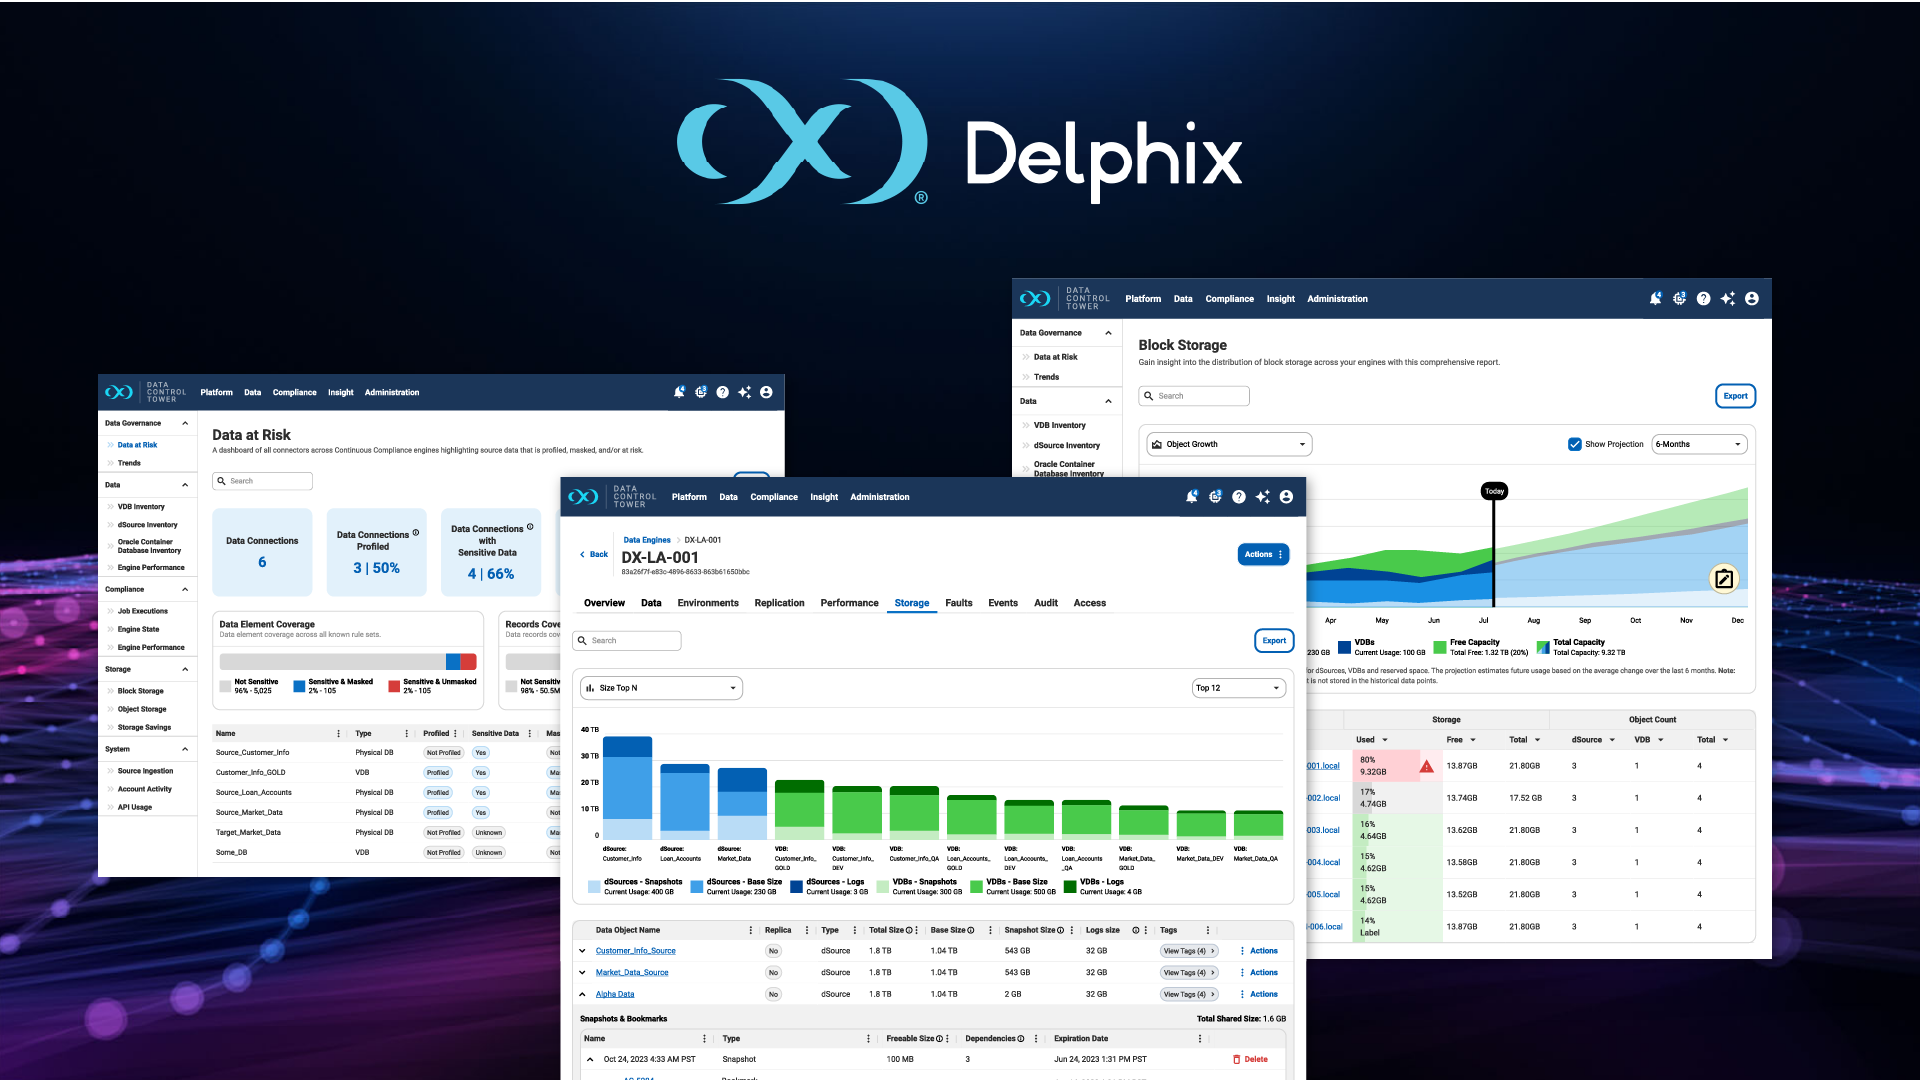
Data Control Tower (DCT) evolved from an API-only platform to become a unified management interface that centralizes control over distributed Delphix engines across an enterprise's infrastructure.

Problem

Enterprise customers struggled to efficiently manage multiple Delphix virtualization and masking engines distributed across their infrastructure. Each engine required individual management and monitoring, creating operational overhead and complexity in maintaining consistent data governance.

The distributed nature of these engines made it challenging to maintain visibility across environments, track resource usage, and ensure consistent security policies, leading to increased management complexity and potential compliance risks.

Key Considerations

Technical Complexity: Deep understanding of Delphix's fundamental architecture was crucial for designing intuitive interfaces that accurately represented complex backend operations across distributed engines.

Workflow Integration: Unify management of distributed virtualization and masking engines while maintaining the power and flexibility of individual engine capabilities. Special focus was needed on simplifying complex features like Self-Service data management into more intuitive workflows.

Enterprise Scale: Design solutions that accommodate large-scale deployments while providing efficient central management tools for administrators overseeing numerous engines across different locations.

Feature Simplification: Transform complicated technical concepts into user-friendly operations without losing functionality. The Self-Service module particularly needed reimagining to better serve its target users.

Access Control: Design a flexible authorization system that could accommodate complex enterprise security requirements while remaining manageable at scale.

Solution

Centralized Management Interface: Created a comprehensive web interface that provides unified control over distributed Delphix engines, evolving from the initial API-only version.

Streamlined Multi-Engine Workflows: Designed intuitive processes that enable administrators to manage multiple engines through a single interface, simplifying operations like database provisioning and mask configuration.

Enterprise Visibility: Developed comprehensive monitoring and reporting capabilities to provide clear visibility across all engines and environments.

Self-Service Transformation: Reimagined the complex Self-Service addon into an integrated workflow that simplified data management for development teams. Consolidated multiple confusing actions (refresh, rewind, rollback) into a single, guided "refresh" process that clearly communicated data state and timing. This transformation significantly improved developers' ability to manage their own database environments.

Attribute-Based Access Control: Implemented a sophisticated ABAC system that allowed granular control over user permissions based on attributes like role, department, environment, and data sensitivity. This enabled enterprises to implement precise access policies while maintaining scalable user management.

My Contributions

Product Vision and Strategy: Led the development of DCT's product ethos and established core product requirements, shaping how the platform would serve enterprise needs while maintaining simplicity and usability. This foundation ensured the product would effectively address customer pain points while staying true to its mission of simplifying complex data management tasks.

Design Leadership: Served as the lead designer for the multi-year Data Control Tower initiative, driving the project's user experience vision and execution from concept to delivery. This role involved coordinating with multiple stakeholders to ensure the design direction aligned with both technical capabilities and business objectives.

Technical Partnership: Collaborated closely with engineering teams to understand engine capabilities and constraints, ensuring designs aligned with technical requirements.

Workflow Optimization: Analyzed existing customer processes to identify pain points and opportunities for centralized management and automation.

Interface Architecture: Developed a coherent design system that unified engine management while maintaining flexibility for future expansion.

High-Fidelity Prototyping: Built detailed, interactive prototypes that closely mirrored the final developed product, enabling effective user testing and providing clear implementation guidance for engineering teams.

Results

Operational Efficiency: Significantly reduced time required for managing multiple engines through centralized control and monitoring.

Adoption Success: Successfully transitioned customers to the centralized management interface, improving visibility and reducing operational complexity.

Enhanced Security: Simplified multi-engine management processes reduced risk of misconfiguration and improved compliance capabilities across distributed environments.
February 04, 2025 /Jake Smith

Sammons Policyholder Account Redesign to Boost Digital Adoption

April 08, 2024 by Jake Smith

Problem

  • Sammons faced declining digital adoption of its customer portal due to login issues and difficulty in completing routine tasks.

  • The portal's outdated technology and design created friction for customers, leading to increased support costs and a negative user experience.

Key Considerations

  • Accessibility: Prioritize accessibility guidelines, with a clear visual hierarchy and large interaction areas, for an older user base (average age 60+).

  • Ease of Use: Design for infrequent usage with minimal cognitive load. Emphasize intuitive navigation and self-explanatory task flows.

  • Flexibility: Create an adaptable design system to accommodate multiple Sammons brands while providing customization options for each unique product line. View Design System Project

Solution

  • User-Centric Approach: Extensive user research (surveys, interviews, moderated studies) established a baseline understanding of the existing portal's pain points.

  • Iterative Design: Rapid prototyping and usability testing refined design solutions.

  • Key Design Element: A prominent "What would you like to do today?" section featuring common and seasonal actions streamlined user journeys, reducing the need for extensive navigation.

My Contributions

  • Collaborative Research: Partnered with UX researchers to strategize, conduct, and analyze user studies to inform design decisions.

  • Design Leadership: Led the multi-year design initiative, creating and testing iterations to achieve optimal user experience.

  • Data-Driven Validation: Monitored post-launch analytics and sentiment analysis to quantify the redesign's impact.

Results

  • Quantifiable Success: Achieved a massive reduction in customer support calls alongside a 143% increase in digital transactions.

  • Enhanced Customer Satisfaction: Policyholder account view ratings increased by 56%.

Research One-Pagers

April 08, 2024 /Jake Smith

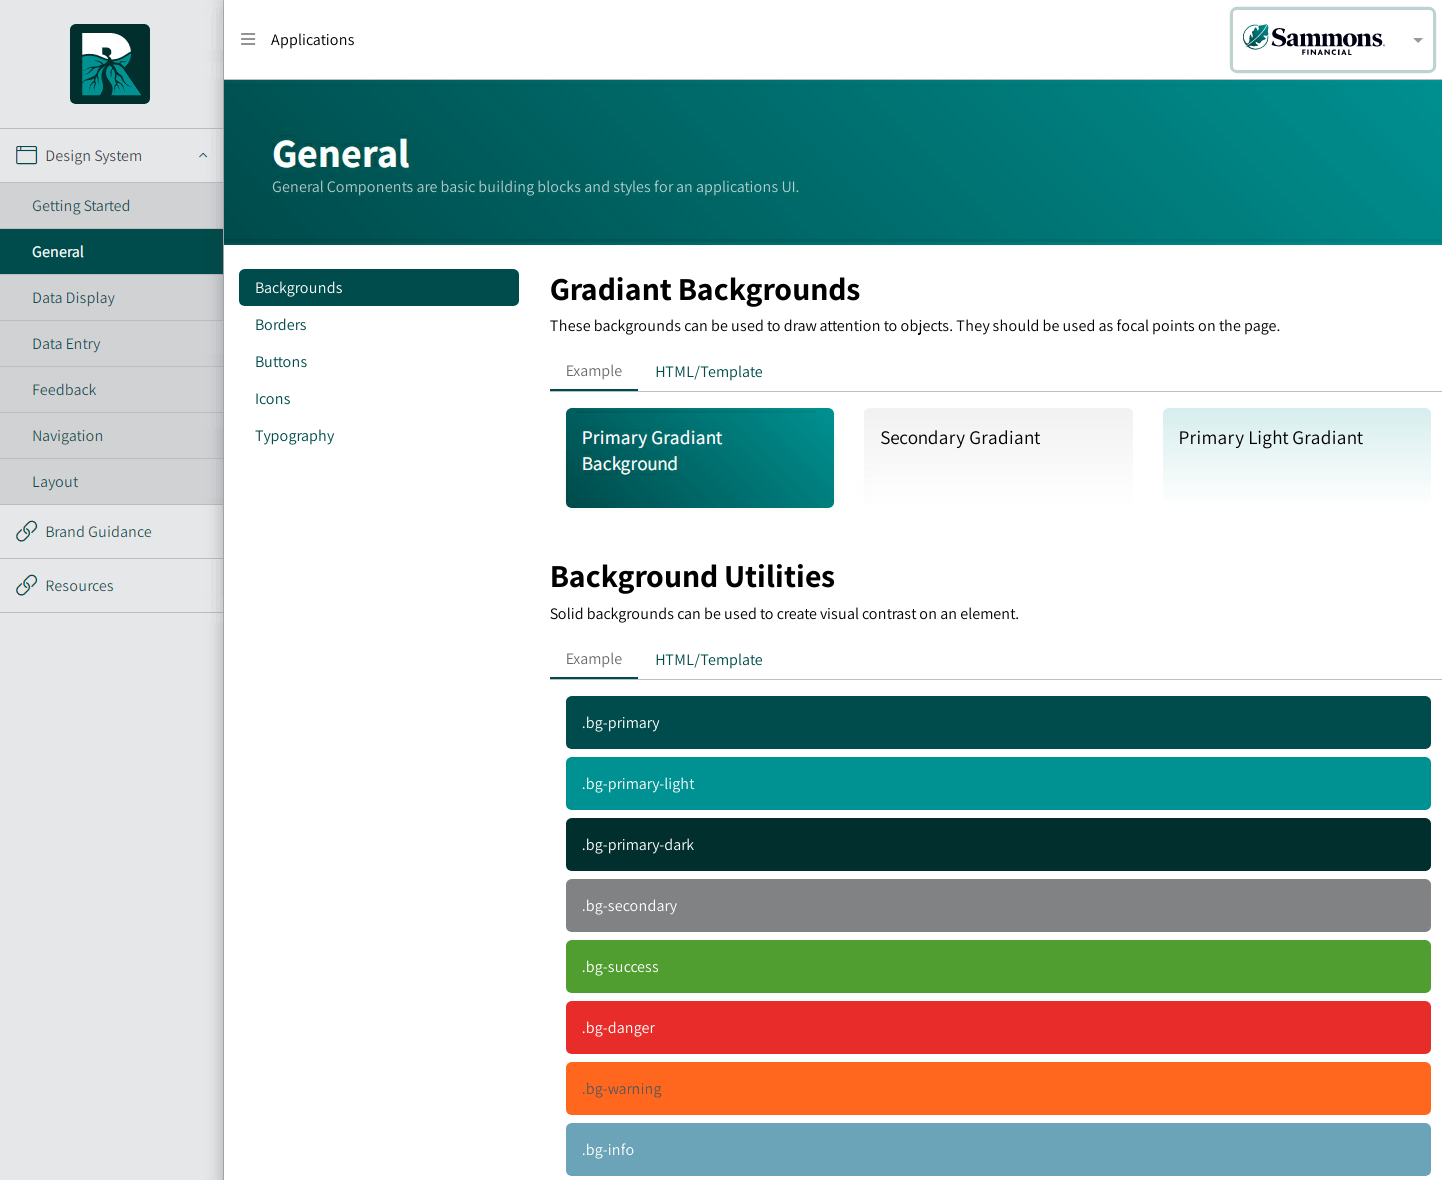
Root: A User-Centric Design System for Sammons Financial

April 08, 2024 by Jake Smith
View fullsize NAC - backgrounds.png
View fullsize Root Colors.png
View fullsize Root Home.png
View fullsize SFG - Backgrounds.png
View fullsize SFG - Basic Switch.png
View fullsize SFG - Card Grid (Component Typescript).png
View fullsize SFG - Card Grid (HTML).png
View fullsize SFG - Card Grid.png
View fullsize SFG - Feedback Empty State (with HTML example).png
View fullsize SFG - Getting Started.png
View fullsize SFG - Group Buttons Basic and Radio.png

Spearheaded the development of a comprehensive and accessible design system for Sammons Financial, resulting in improved brand consistency, development efficiency, and overall user experience.

Problem

Sammons Financial, with its diverse sub-brands, faced challenges in maintaining consistent design and development practices. This led to:

  • Inefficiencies in design and development efforts across multiple applications.

  • Redundant solutions for brands with similar requirements, hindering scalability.

  • Inconsistent user experiences across branded touchpoints.

Key Considerations

  • Theming: The design system needed to support customization for each sub-brand's unique visual identity.

  • Developer Integration: The system had to streamline workflows and accelerate development processes for teams across the company.

  • UX Best Practices: Inherently promoting UX principles within the design system was crucial to ensure quality user experiences.

  • Accessibility: Prioritizing accessibility standards (e.g., WCAG) was paramount to cater to Sammons' primary user demographic (60+ years).

Background

Root started as a “grassroots” effort to provide a consistent user experience across Sammons's multiple brands so that our small UX team could support all the development projects. However, the company's limited front-end resources made simple documentation insufficient. The design system needed to be inherently easy to implement and use, making it the most accessible path for developers and the natural default. As the design system gained adoption, marketing identified the opportunity to use it as an asset repository, leading to the integration of a headless CMS.

My Contributions

  • Leadership: Led the design, development, and ongoing maintenance of Sammons Financial's design system.

  • Collaboration: Actively collaborated with the UX team to identify and design reusable components aligned with business needs.

  • Technical Expertise: Developed the design system as an Angular project, distributing it via NPM for effortless integration into development workflows.

Results

  • Development Efficiency: Development teams reported significant time savings due to pre-built components and streamlined styling.

  • Brand Consistency: A more cohesive and recognizable brand experience across applications.

  • Enhanced UX: Standardized UX patterns promoted usability and reduced user friction.

  • Accessibility Compliance: Improved accessibility scores ensure a positive user experience.

April 08, 2024 /Jake Smith
Image showing UI elements

Smart Building Platform (IoT)

November 15, 2018 by Jake Smith
View fullsize Action Sets.png
View fullsize Device - Light - Details.png
View fullsize Device - Node – 2.png
View fullsize Device -Wall Control.png
View fullsize Home.png
View fullsize Igor - Gateway – Dashboard.png
View fullsize Igor - Gateway – Dashboard-1.png
View fullsize Locate – Map - Selected.png
View fullsize Schedules – 1.png
View fullsize Settings.png
View fullsize Space Details.png
View fullsize Spaces - Configure Zones.png
View fullsize Spaces – Floor 1.png
View fullsize Spaces – Single- Accouting Cube Area.png
View fullsize OOUX Map.jpg

Problem

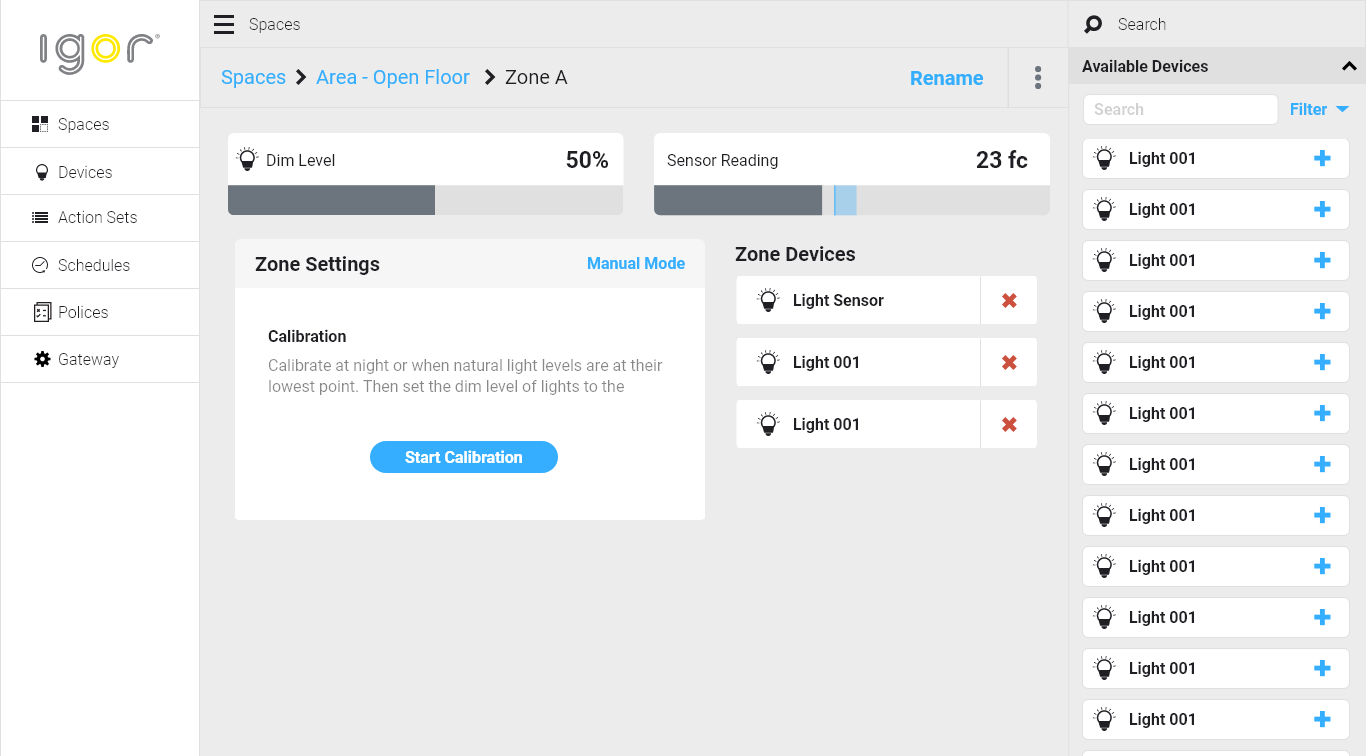
Today’s modern building is a connected “Internet of Things” that integrates everything from the HVAC system to the lighting. The business had a functional administration platform but it was not very user-friendly. The task was to create a design system and build a brand new interface for managing the IoT platform.

Key Consideration 

  • Information Architecture of devices, spaces, and buildings.

  • Progressive disclosure on advanced functionality so that the everyday things are upfront and the more advanced stuff is available but doesn’t get in the way.

  • Custom design system to anchor everything in a consistent look and feel and enable design and scale.

Background

This was a large project that needed to be broken down into smaller components that is why we started by defining a design system that integrated into the front-end development tools. This enabled fast-paced design and development.

Users

  • Building Administrators

  • Building Floor Managers

  • Building Occupants

My Contributions

  • Defined and built the design system

  • Prototyped the platform experience

  • Solved complex information architecture problems

  • Build the UI using Angular

  • Worked with backend and firmware engineers to ensure their solutions matched user expectations

November 15, 2018 /Jake Smith

Sales Dashboard

April 28, 2018 by Jake Smith
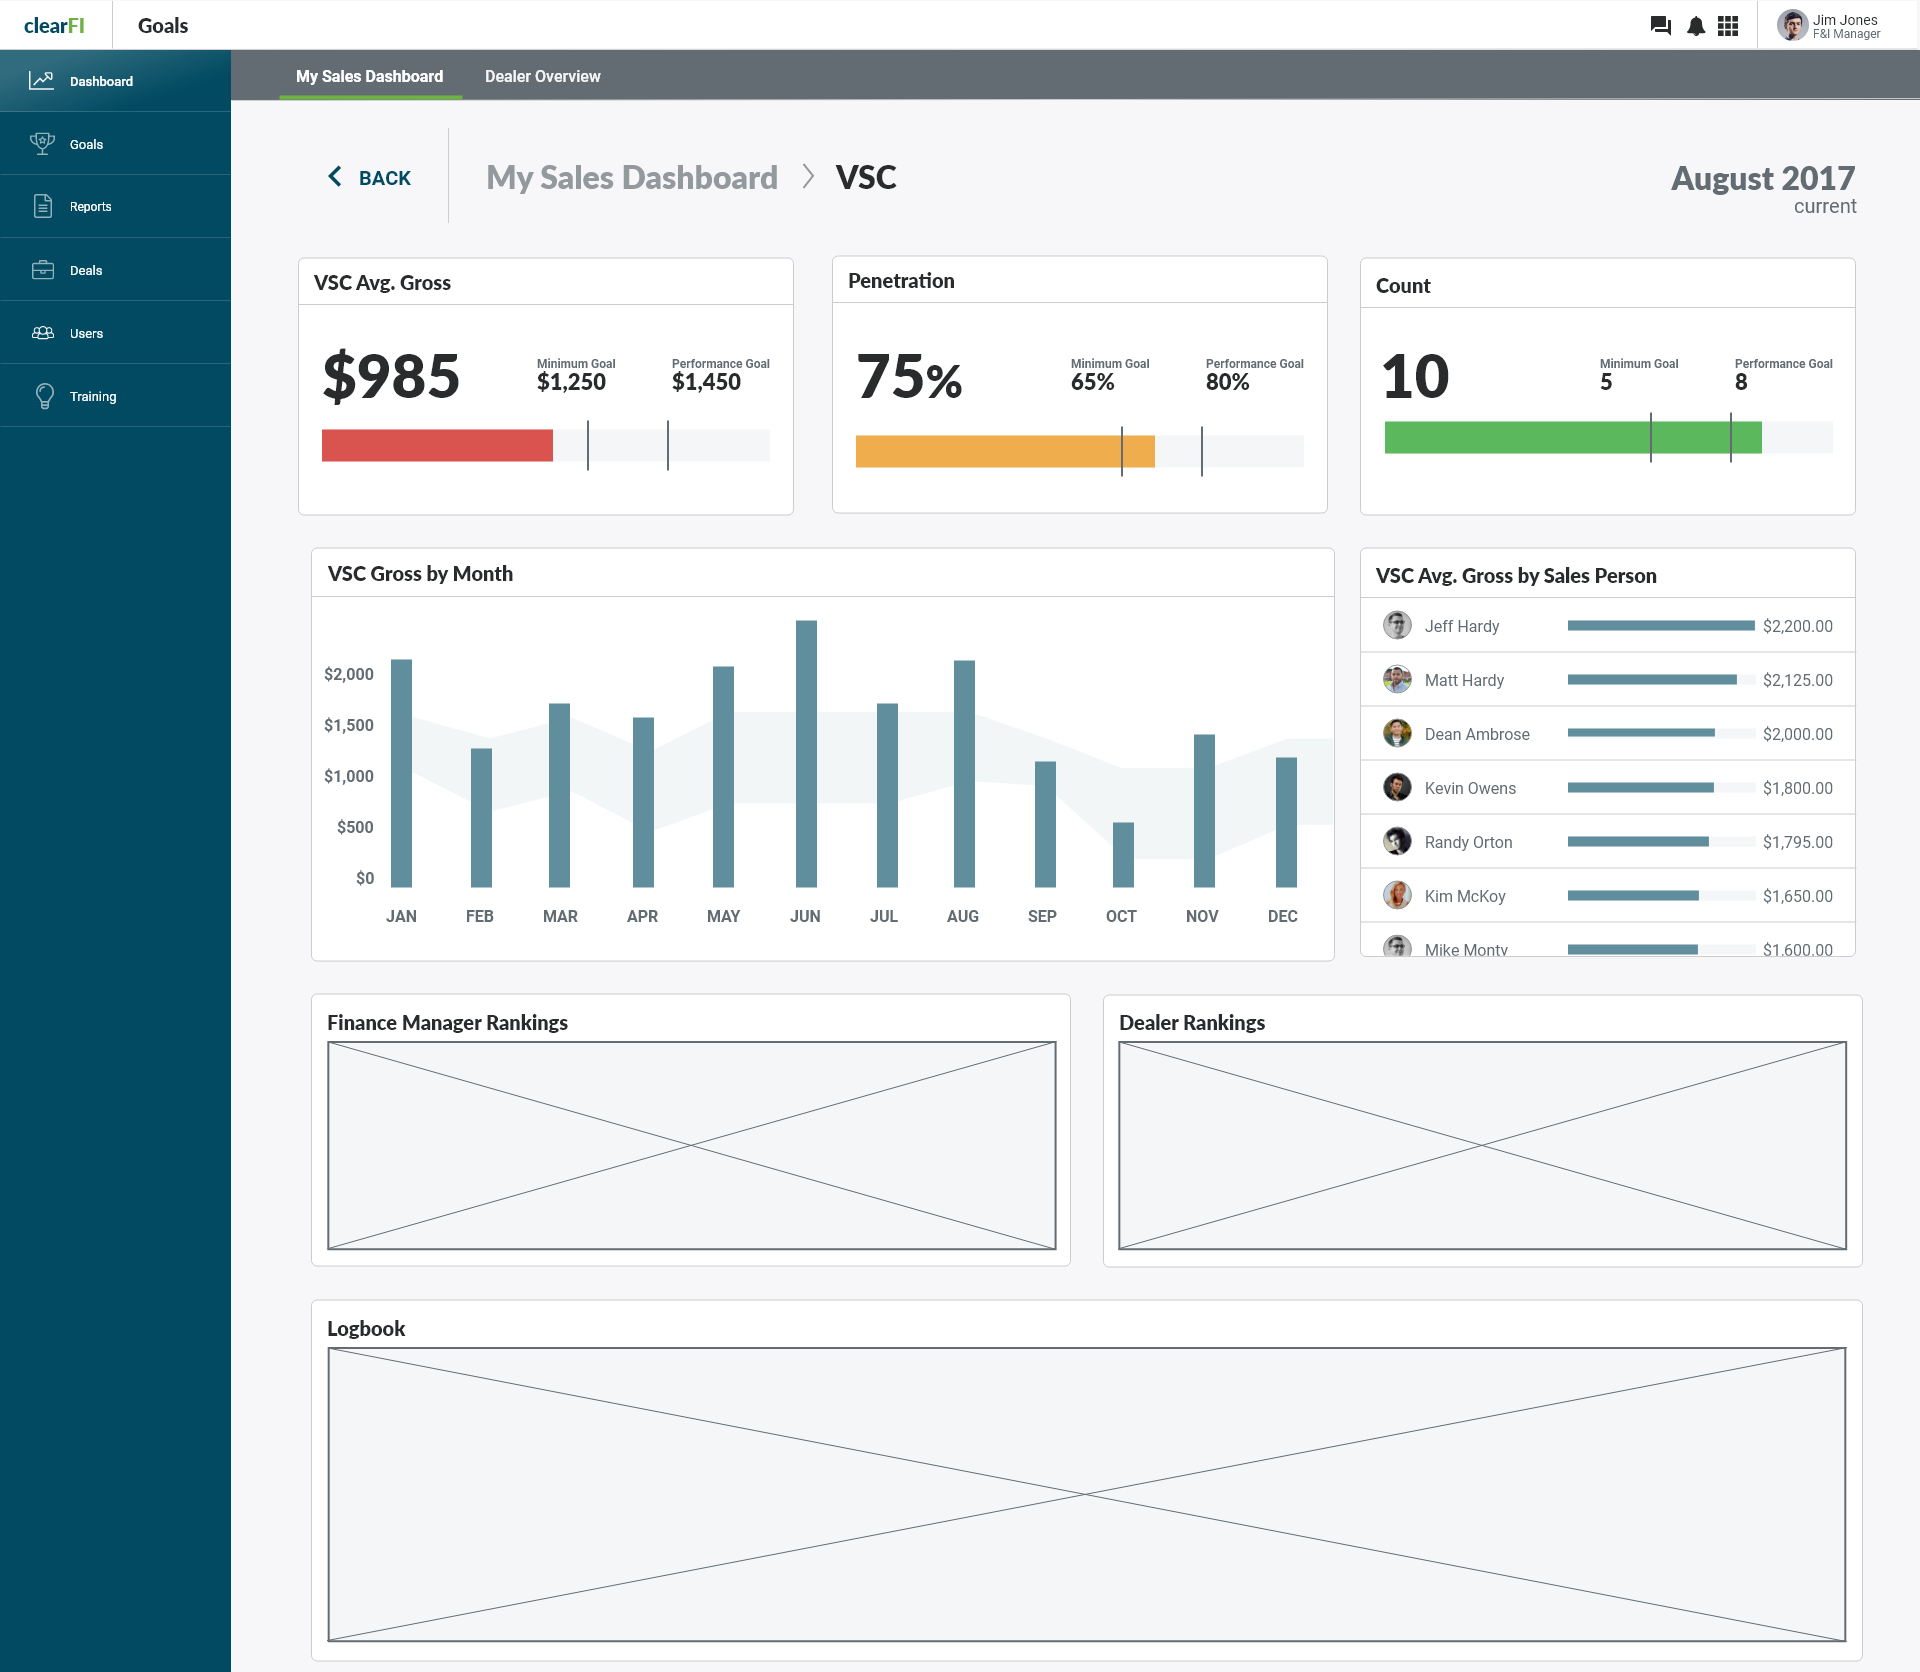
View fullsize clearFI - Dashboard – Dealer Overview.png
View fullsize clearFI - Dashboard – Penetration Dashboard.png
View fullsize clearFI - Dashboard – VSC.png
View fullsize clearFI - Dashboard.png

Problem

Complex sales environments with advanced data analytics can be extremely useful to make business decisions however more often than not the data becomes overwhelming and it becomes hard to know what is important.

Key Consideration 

  • Clear data visualizations to clearly spot what sales goals are being met and who is falling behind.

  • Helping users find the signal in the noise.

  • Giving advanced functionality and analytics without overwhelming the user.

  • Roles and permissions were a key aspect of the project so that people could see what they needed to without exposing sensitive data.

Background

The objective was to create a dashboard for distribution partners to set and track sales goals. The industry had many specific KPIs that needed to be presented so they could keep an eye on the health of their business. Creating data visualizations that met the complex needs of the business was a significant challenge. We landed on some standard charts and also some unique data visualization including a horizontal bar chart that showed the minimum and ideal sales goals for various KPIs.

Users

  • VP of Sales

  • Sales Executives

  • AVP of Sales

  • Internal Sales teams

My Contributions

  • Worked with stakeholders to understand the KPIs of the business

  • Designed high fidelity UX Prototypes

  • Designed unique data visualizations

  • Teamed up with development teams to execute design prototypes

April 28, 2018 /Jake Smith
Image of UI elements

Road Side Assistance

June 01, 2017 by Jake Smith

Problem

We rely on our cars and when they break down it is a stressful situation. How can an app requesting roadside assistance help users get the help they?

Key Consideration 

  • Remembering empathy for the driver during their stressful situation.

  • Providing transparent feedback to help the driver know what is going to happen and when.

  • Creating an interface that could be used while distracted since drives are often juggling multiple tasks when their car breaks down.

Background

The project started with an existing application to help drivers call for roadside assistance. However, the challenge was to integrate new features and partnerships into the application without adding unnecessary obstacles. One example was a feature that would help you request a Lyft ride after you have sent for your car to be towed so that you would not be stranded.

One of the foundational assets I created to help understand both the user and the problem was an OOUX map (Object-Oriented User Experience Map). This map helped establish the key aspects of the problem and led to us being able to understand how new features or partnerships may be integrated with the existing mobile app.

My Contributions

  • Worked closely with UX Researches to understand the users

  • Created multiple OOUX maps to understand complex application interactions

  • Assisted the UX development team to develop designs that meet the user’s needs

June 01, 2017 /Jake Smith

Emergency Department Application

May 13, 2017 by Jake Smith
View fullsize Analytics - Admittance - Archive.png
View fullsize Analytics.png
View fullsize Hospital - Lab.png
View fullsize Hospital - Radiology.png
View fullsize Menu - Metrics.png
View fullsize Menu - Patient Tracker@2x.png
View fullsize Metrics - Time to Doctor@2x.png
View fullsize Overview – Achive.png
View fullsize Overview.png
View fullsize Patient Tracker@2x.png
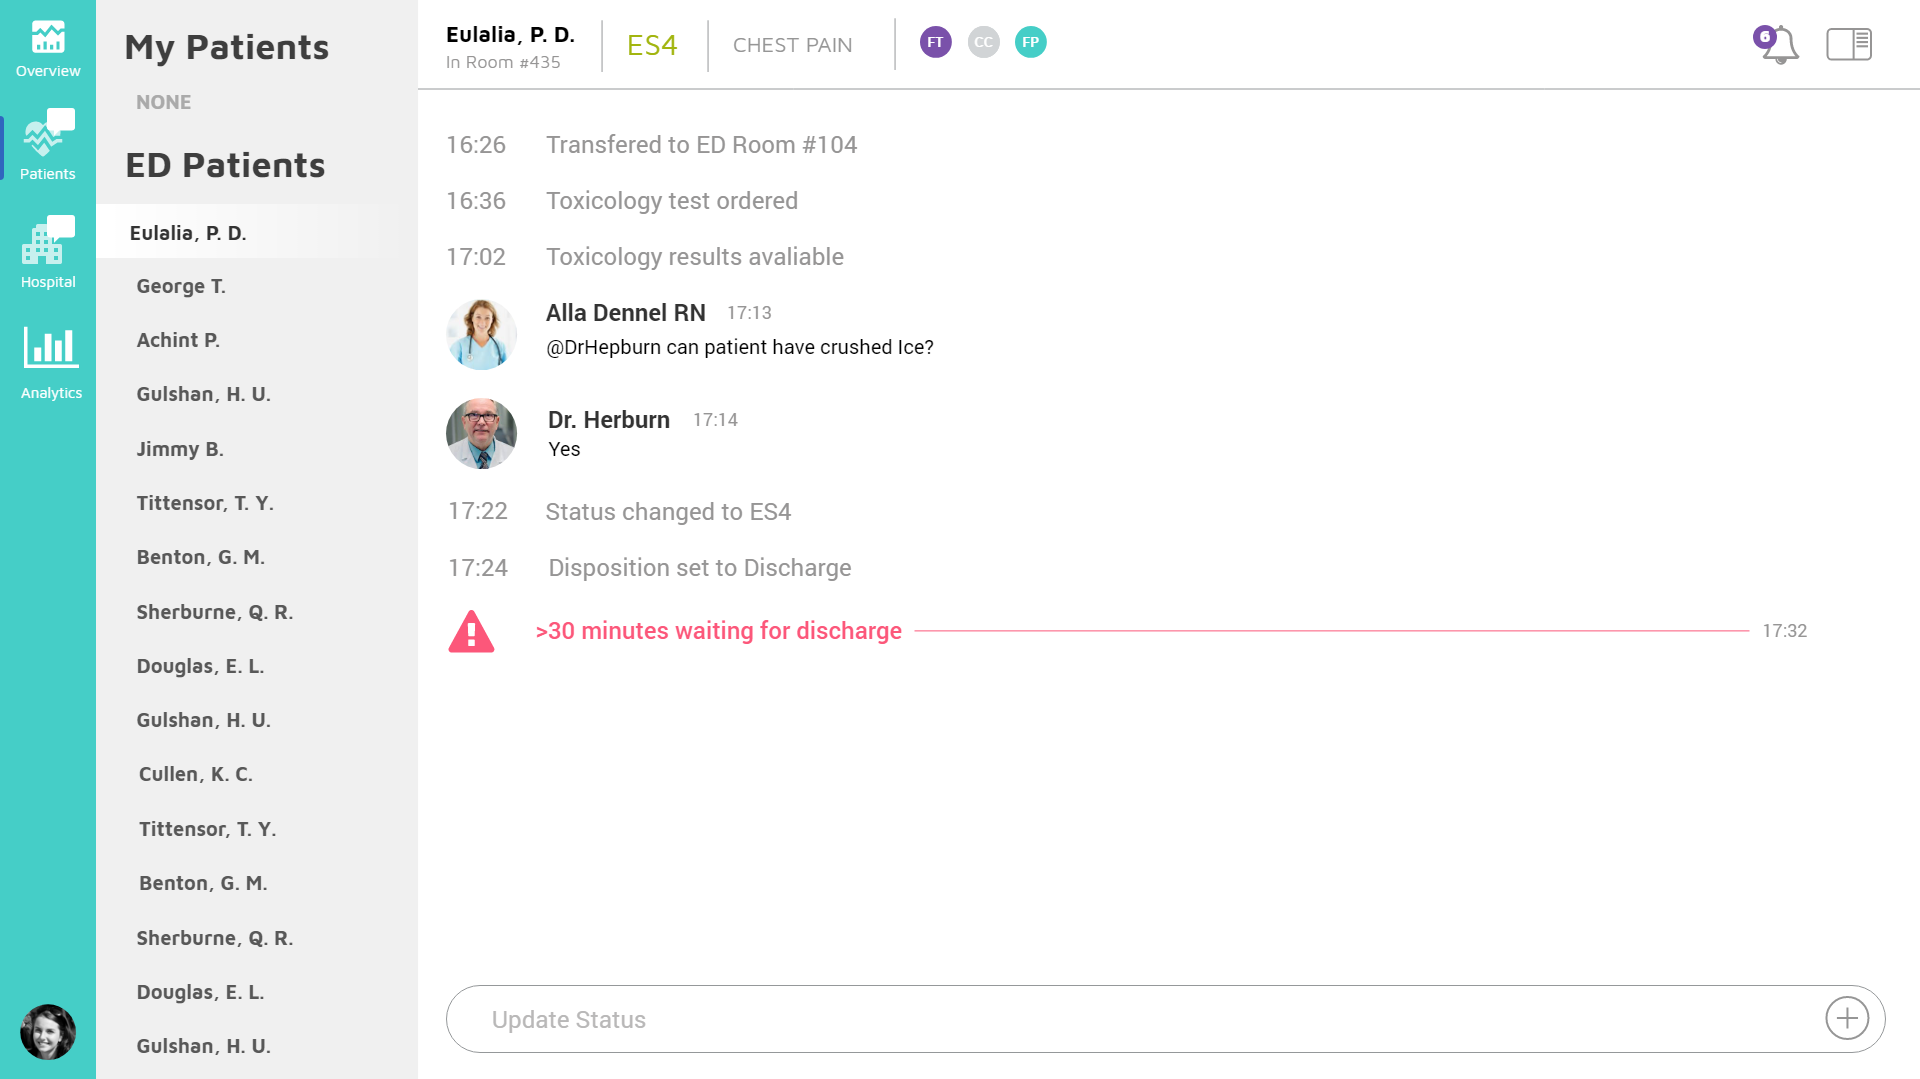
View fullsize Patients – Eulalia P. D..png
View fullsize Sign-In.png

Problem

Communication and efficiency in Emergency Departments are a life and death matter. Bottlenecks increase wait times for patients, this causes an increase in the hospital's "left without being seen" metric.

Key Consideration 

  • Improve workflow for clearing up bottlenecks.

  • Give analytic insight to key metrics.

  • Create a solution that would integrate with current EMR software.

Background

The team was challenged to research and create a prototype for Emergency Departments. Through extensive industry research, we identified key issues that ED face including bottlenecks, long wait times, communication, and predicting ED surges. 
Users

We identified multiple users that would need to interface with the solution including the following.

  • Unit Secretary 

  • Doctors

  • Nurses

  • Administrators

  • Lab Technicians 

For Doctors and Nurses, we discovered through user interviews that they needed the application to fit within their existing workflow as they don't have time to add anything else to their workload. This is why we leveraged a UI pattern made famous by Slack letting Doctors and Nurses communicate relevant information quickly saving valuable minutes in the ED.

Administrators are focused on the larger picture of how the ED is flowing. We provided a way for them to see the health of the ED quickly and help them identify bottlenecks.  

View Prototype

My Contributions

  • Researched the needs of a modern ER by conducting interviews

  • Researched the industry to understand what needs might be met with a new approach to ER communication

  • Designed high-fidelity UX prototype

  • Created custom data visualizations unique to the needs of the ER

May 13, 2017 /Jake Smith
Showcase.png

Digital Catalog Application

April 10, 2017 by Jake Smith
View fullsize Login.png
View fullsize Product - Single.png
View fullsize Splash.png
View fullsize Categories.png
View fullsize Login – 1.png

Problem

The client needed a mobile application to showcase their product line up. A major motivation for the app was to cut down on printing and shipping of physical catalog.

Key Consideration 

  • Incorporate client branding.
  • Showcase products in an appealing manner.
  • Easily navigate complex information architecture.  

Background

Panache International is an integrated manufacturer and distributor of a disposable range of plastic, paper, aluminum and bamboo packaging products since 2005 in the United Arab Emirates. They needed to transform their physical product catalog into a mobile app.

Users

The users are a restaurant, catering, or other food business owner who is looking to improve their customer's experience and also cut costs. Being able to quickly view the product categories that interest them and then see the price comparisons is a critical component to the user's experience.

View Prototype

April 10, 2017 /Jake Smith

Event Application

April 10, 2017 by Jake Smith
View fullsize Activity – 2.png
View fullsize Attendee – 3.png
View fullsize Attendee – 4.png
View fullsize Connect – Matches.png
View fullsize Connect.png
View fullsize Single Speaker – 1.png

Problem

How can we make the experience of events more powerful using mobile?

Key Considerations

  • Suggest who attendees should network with based on interests, location, and title.
  • Users can post questions to speakers through the app.
  • Activity feed helps attendees know whats going on and what to expect next. 

Background

Our team partnered with The Growth Summit who hosts newsmakers and thought leaders who help out-learn and out-think the competition in the fields of leadership, strategy, marketing, sales, operations, and finance. 

Since the partnerships, we have been creating an event app platform that lets Egen offer fully customized event apps with industry leading features such as using machine learning to suggest who you should meet at the event. 

Users

The users are business owners and executives that are attending the Growth Summit. The main use case for the app is to inform the users on the agenda and what is coming up next. However, the goal of the application was to rethink the experience of the event.

Q&A Feature

One experience our team wanted to improve was that of the Q&A session at the end of a session. In the past, there were a few people with microphones running around to people that had questions. On occasion, the person asking the question would spend a bit too much time articulating it causing the schedule delays. 

The team came up with a solution that allows users to type a question using the mobile app. Users could also vote on other attendees questions pushing them up the list (similar to Reddit voting). During the Q&A the questions would be fed to the admin web application to be projected. 

This solution drastically improved the efficiency and allowed the speaker to answer the most meaningful questions and more of them. Quantitative and qualitative feedback indicated a highly positive experience for attendees. 

View Prototype 

April 10, 2017 /Jake Smith
Blue Style.png

Field Service Application

April 10, 2017 by Jake Smith
View fullsize Inspection Reports - cards stacked – In Progress – 1.png
View fullsize Inspection Reports - cards stacked – In Progress.png
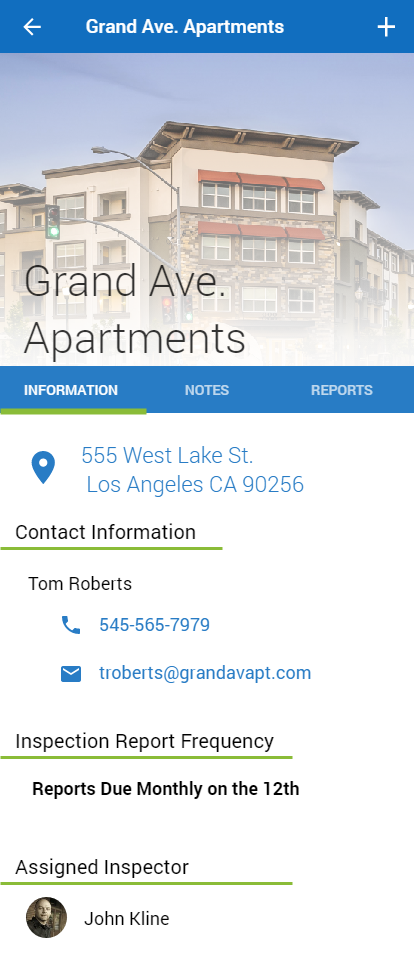
View fullsize Properties -Grand Ave.png
View fullsize Recurring Reports - New Items - Add New.png
View fullsize Recurring Reports - New Items.png
View fullsize Recurring Reports - Past Items - Issue Remains.png
View fullsize Recurring Reports - Past Items.png
View fullsize Reoccurring Inspection Reports – Add New.png

Problem

The company needed to streamline their property inspection process to grow their business.

Key Considerations 

  • Needed to incorporate the user's current workflow.
  • Easily create new reports.
  • Friendly UI that leveraged existing user mental models.
  • Multiple iterations based on user feedback.

Background

ProTec Building Services (ProTec) was founded in 1996 with a mission to provide a range of services and guaranteed quality work by Professional Technicians to HOAs and managers.  

ProTec came to the team looking for a better solution to replace their current mobile inspection app. Their current app was not saving them time and was causing frustration.

Users

The users are ProTec Property Inspectors who needed a mobile app that would let them create multiple report types for a property listing potential issues.

Understanding the Workflow

It was important for the team to know the types of reports and the kinds of items that the users would be adding to the reports. We broke down the reports and item types by using an "objects and tasks." information architecture technique to understand the relationships between all the elements better. 

We then spoke with the users and made some iterations based on some new edge cases we had not initially considered. We ended up presenting the users with the reports that needed to be completed the soonest to help them prioritize their workload. They then would be able to quickly start a report and add items by simply snapping photos of the issues they found. 

View Prototype 

April 10, 2017 /Jake Smith
Kulture-Full.jpg

Company Culture App

April 10, 2017 by Jake Smith in Mobile Application
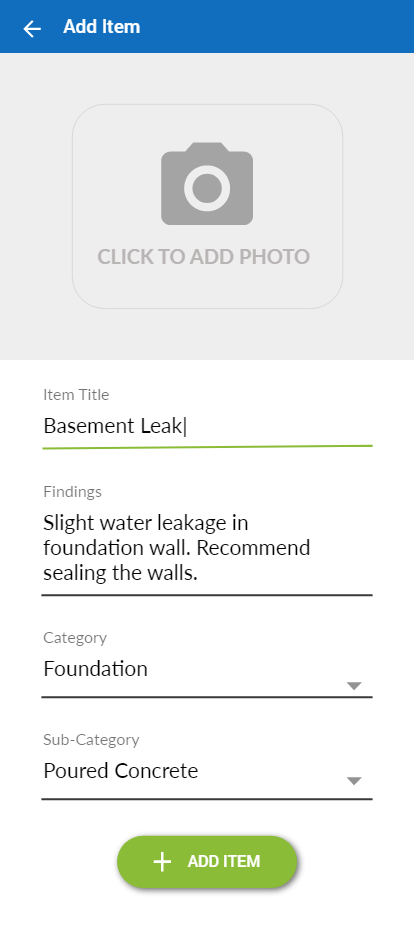
View fullsize Add Item.png
View fullsize Feed.png
View fullsize My Account.png
View fullsize Badges.png
View fullsize Create Your Admin Account.png
View fullsize Login  Sign Up.png
View fullsize Settings.png
View fullsize Setup Company.png

Problem

How can business encourage their company values and build a healthy culture on top of them?

Key Considerations

  • Needed a clean easy-to-use interface.
  • Kept interactions patterns similar to popular social media sites to encourage usage. 
  • Added a gamification component.

Background

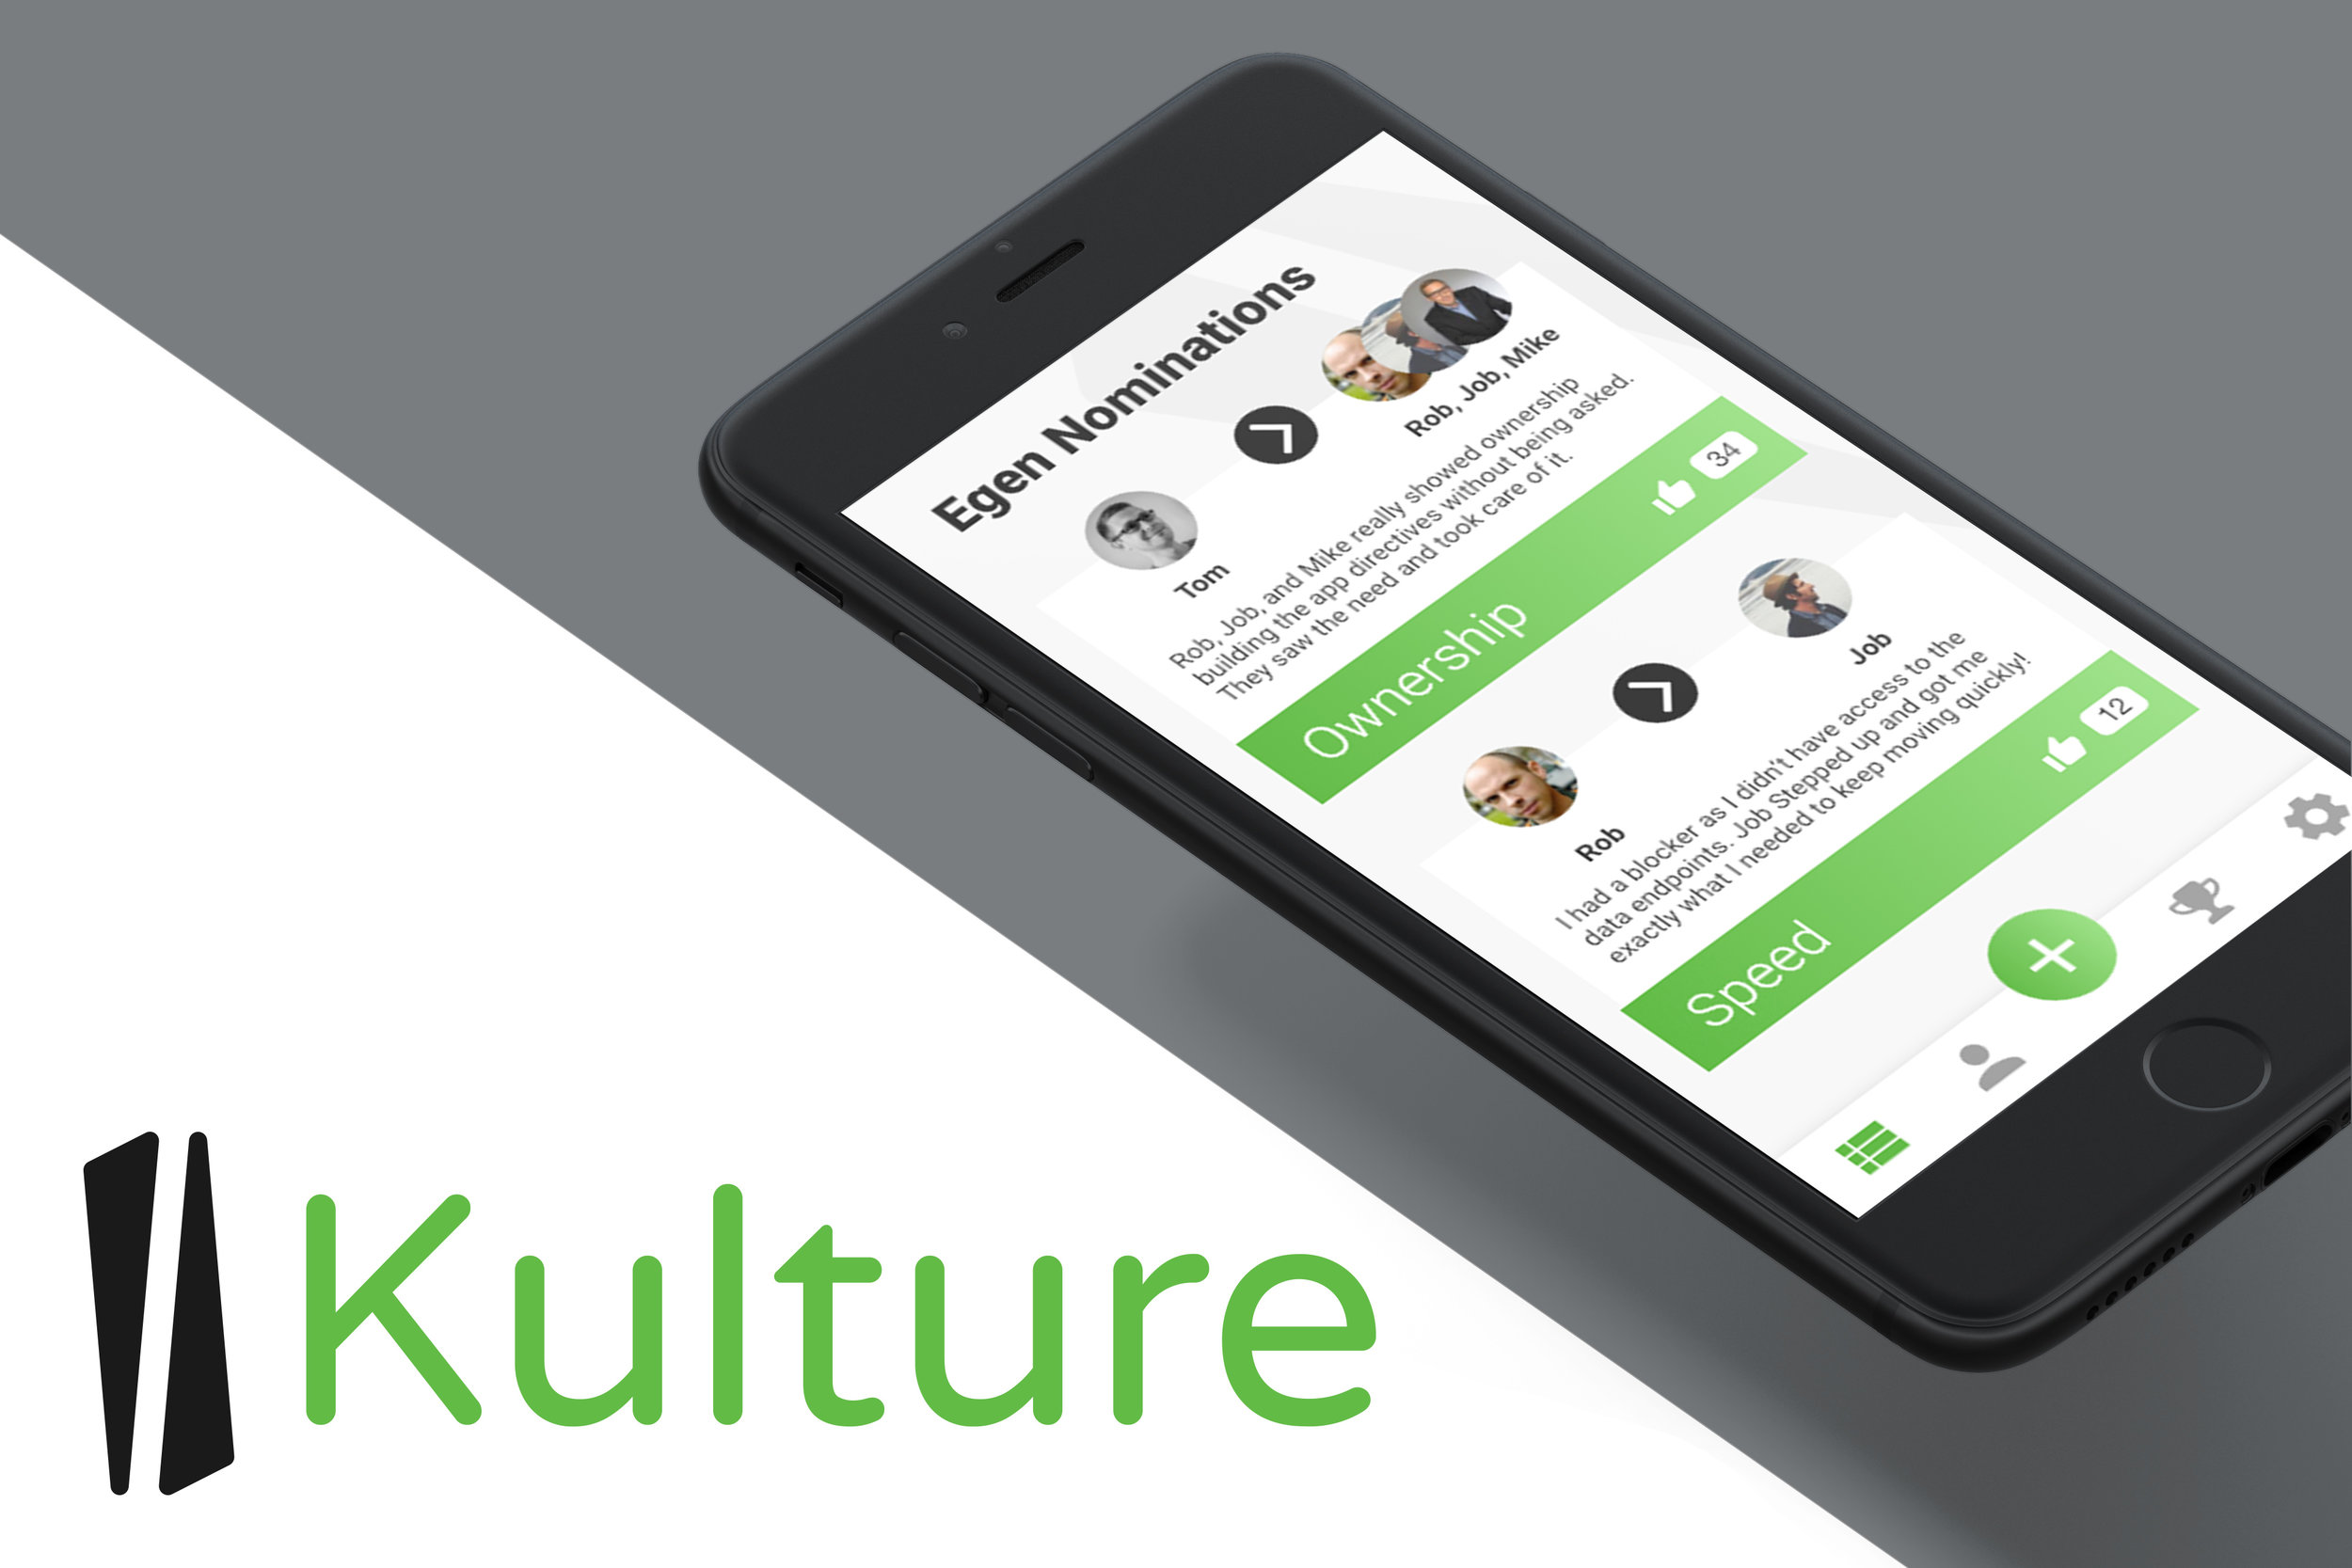
Kulture is a concept we developed internally at Egen. The goal was to help encourage the company values throughout an enterprise. 

Users

The users of the app are employees of any company that wants to help build a culture based on their values. From some quick user interviews, we concluded that for the product to stick it needed robust social feedback loops.

Psychology & Social Research

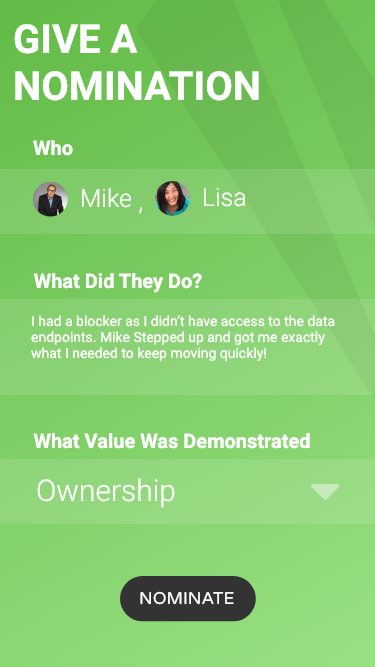
Creating successful social feedback loops, we researched many existing popular social platforms to dissect how and why their models worked. We keyed in on the principle of encouragement allowing users to post stories on how co-worked demonstrated values. Then other users would vote on the stories they thought demonstrated the company values.

View Prototoype 

April 10, 2017 /Jake Smith
Mobile, Concept, UI, UX
Mobile Application